Using Excel formulas can help you speed up your schoolwork and analysis. Excel is capable of a multitude of mathematical and graphical functions. The only thing you need to do is know how to use it!
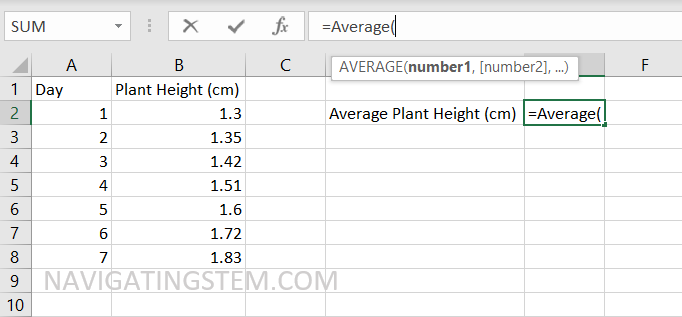
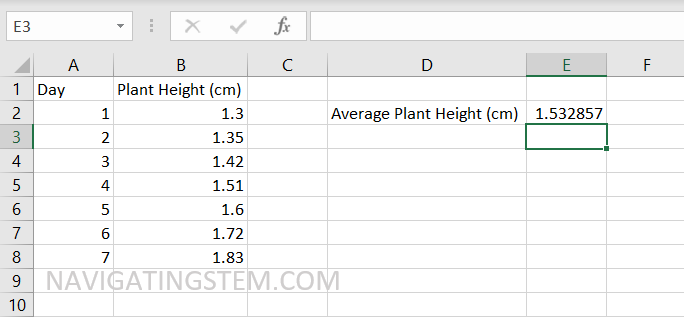
We are going to use example data that is plant height in centimeters for each day in a week. For this example data, we want to know the average plant height over the week we conducted this example experiment.
The formula that we can use is “Average” and we will type in =Average(
After typing in =Average( we can either use our cursor to drag and select the data we want the average of, or type in the cells. In this case we want B2, B3, B4, B5, B6, B7, and B8. We could type in =Average(B2, B3, B4, B5, B6, B7, B8) and Excel would give us the average. With a few cells this won’t be a problem, but if we work with more data points we want a faster way to do this. We can tell excel to look at all the cells in between two cells by using a colon “:” in between the names. We can use =Average(B2:B8) and that is the same as =Average(B2, B3, B4, B5, B6, B7, B8).
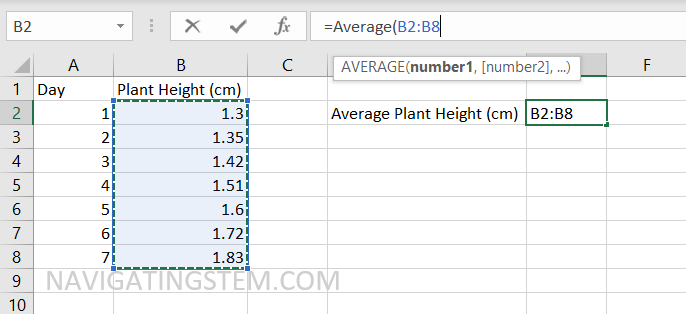
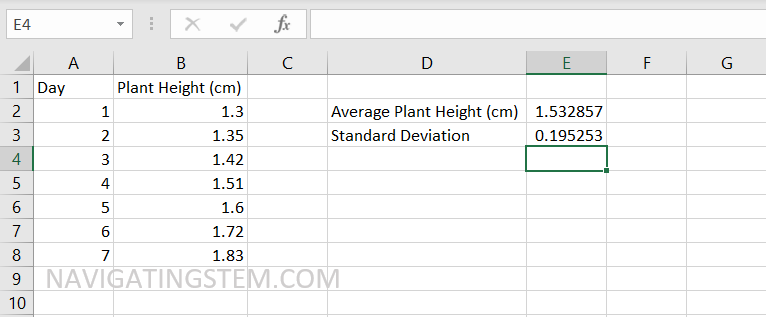
After selecting our cells and typing our formula, we get our calculated Average.
Next, we want to know the standard deviation across our data. In that case we can use the STDEV.S formula.
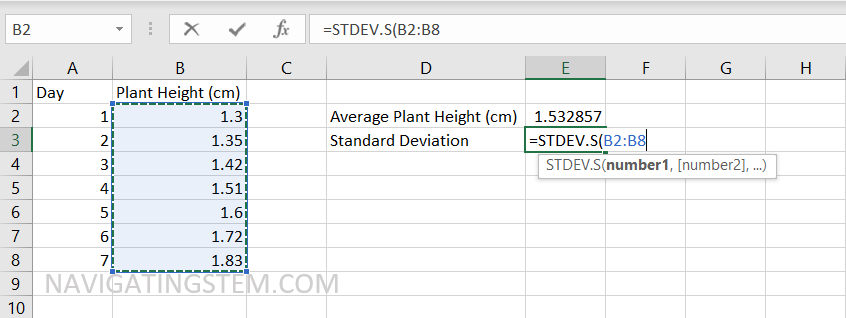
After selecting our data the same way we did with the average, we can see that =STDEV.S(B2:B8) gives us the standard deviation from those points.